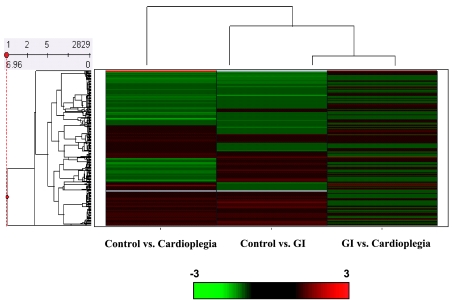
Fig. 2.
Right: hierarchical cluster analysis for CI and GI compared with control to account for constitutively expressed RNAs and CP versus GI to show RNAs up- and downregulated in CP compared with GI. Dendograms are shown on the left, with a scale bar. Cluster numbers for control versus CP are shown on the left. The red color indicates upregulated RNAs, and the green color indicates downregulated RNAs.

