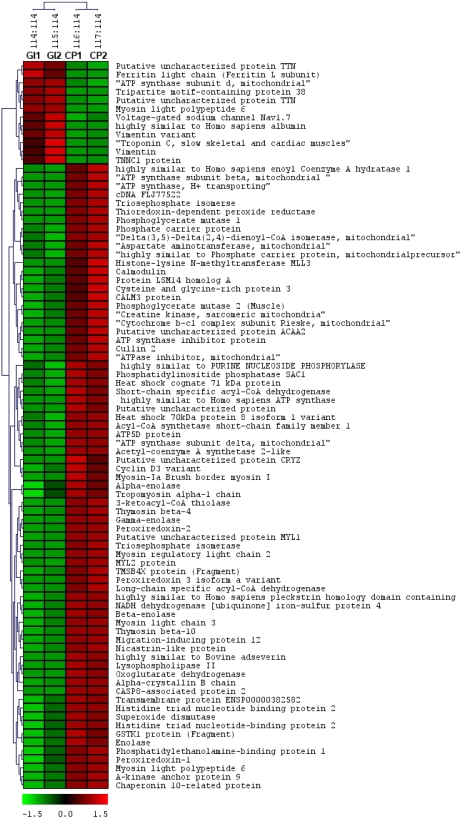
Fig. 4.
Hierarchical cluster analysis for proteins having >1.4-fold change between CP and GI. The proteins are identified with short descriptions obtained from the SWISS-PROT database. Protein expression is shown with a pseudocolor scale (from −3 to 3) with the red color indicating a high expression level and the green color indicating low expression in CP compared with GI.

