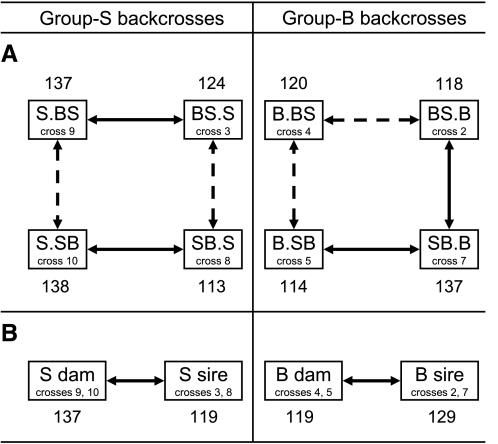
Fig. 1.
Overview for statistical comparisons of 129X1/SvJ (group S) and C57BL/6J (group B) backcrosses. A: single backcross comparisons. Median survival times (MSTs; in h) were compared between backcrosses, which were split into group S (left; crosses 3, 8, 9, and 10, which yielded SB or SS genotypes) and group B (right; crosses 2, 4, 5, and 7, which yielded SB or BB genotypes) mating schemes. To assess parental effects, each backcross group was compared with two other backcrosses: 1) that with the same inbred dam or sire but a reciprocal F1 mate or 2) its reciprocal backcross. B: paired backcross comparisons. Within group B and S, the two backcrosses generated from the same inbred dam were combined, and the MST was compared with that for the two backcrosses generated from the same inbred sire. Solid lines between crosses represent statistical differences in MSTs (P < 0.05 by ANOVA with Sidak correction); dashed lines represent no differences between MSTs of offspring from the compared crosses.

