
Figure 8.
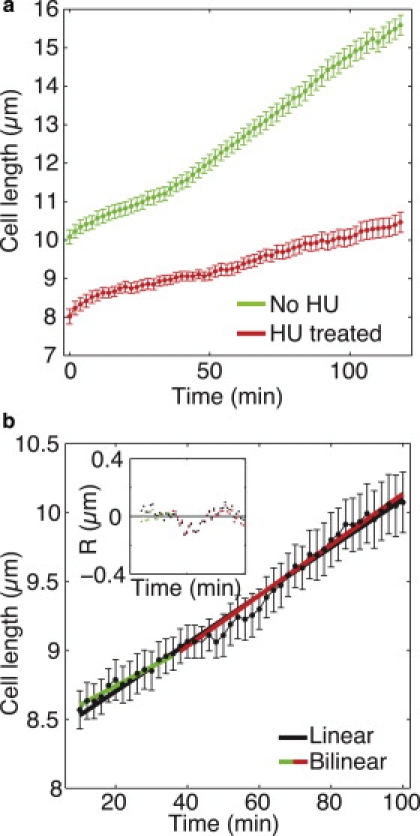
Growth of cells blocked in S-phase by HU. (a) Mean cell length is shown as a function of time for the HU-treated cells (red) and the untreated cells (green), both growing at 32°C. Error bars represent SE. (b) Linear (black) and bilinear (green and red) fits to the mean length data of HU-treated cells. The inset shows the residuals for both fits in corresponding colors. The fitting was performed for t = 10–100 min.