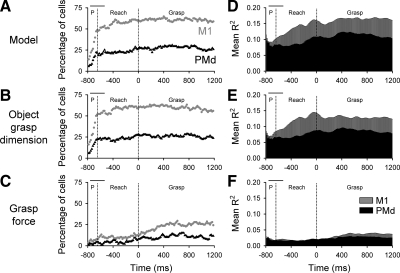
FIG. 11.
M1 cells (gray) were more actively engaged during reach-to-grasp than PMd cells (black). A–C: the percentage of cells with significant R2model (A) for monkeys G and L and corresponding percentages of partial R2gd (B) and R2force (C) parameters. D–F: averaged R2model (D) and corresponding averaged partial R2gd (E) and R2force (F) parameters. First vertical line represents the average onset time for the premovement (P; ±SD) and the 2nd line represents the onset of grasp.

