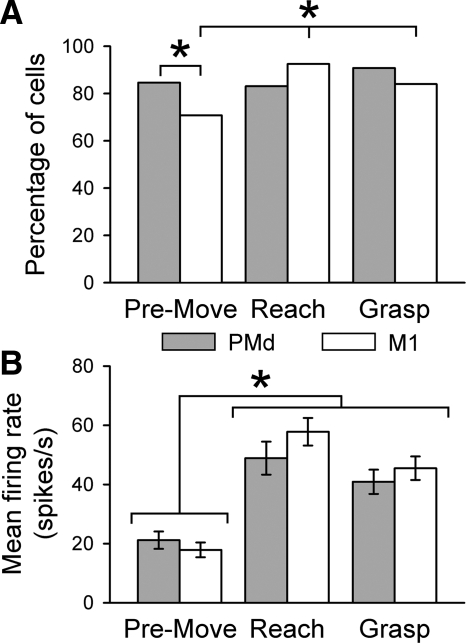
FIG. 3.
A and B: the percentage of cells (A) with significant mean firing rates (B) across epochs for PMd (gray) and M1 (white) cells. The total number of task-related cells was based on significant increases in firing relative to the baseline (paired t-test, P < 0.05 during ≥1 epoch). *Significant χ2 at P < 0.05 (A) and significant F at P < 0.05 (B).

