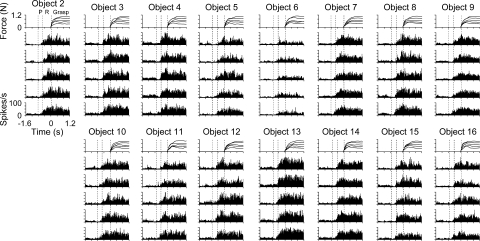
FIG. 4.
Example of a task-related M1 cell (L061) with significant object-related firing. Histograms and force profiles represent the averaged cell firing rate and grasp force levels, respectively, across all trial repetitions for each object (2–16) and force level (1–5 N). Histograms are ordered with the repetitions of the lowest force (0.2 N) on the bottom and highest force (1.0 N) on the top for each object. In this and subsequent figures, all data were aligned on grasp initiation (time = 0). Three vertical dashed lines represent the average onset times for the premovement (P), reach, and grasp epochs.

