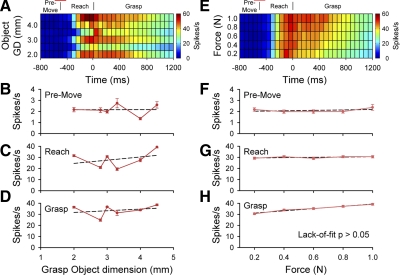
FIG. 7.
A and B: example of an M1 cell (L052) with object grasp dimension and force-related modulation. Color plots for the mean firing rate by object grasp dimension (A) and grasp force levels (E). B–H: mean firing rates and SE across object grasp dimension (left) and force level (right) during the premovement (B and F), reach (C and G), and grasp (D and H). Post hoc linear regressions indicated that cell firing was not linearly related to the object grasp dimension. Cell firing was linearly related to grasp force during the grasp epoch. Conventions as in Fig. 6.

