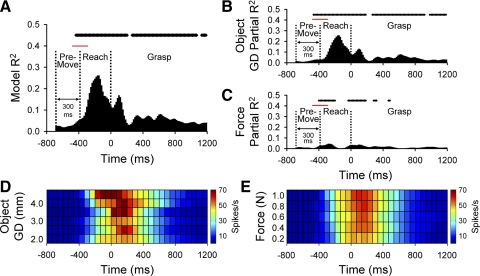
FIG. 9.
A–C: example of a PMd cell (L056) with predominant object-related encoding. The model (A) and partial R2 profiles for grasp dimension (B) and grasp force (C) parameters. Above each bar plot a raster display indicates times at which the discharge was significantly correlated with the model parameter. A time bin was considered significant only if the model or partial R2s remained significant for 83 ms. D and E: color plots of the firing rates over time, averaged across objects (D) and force levels (E). Vertical dashed lines in the bar plots represent the average onset times for the premovement, reach, and grasp epochs with the SD indicated by a horizontal bar at the top.

