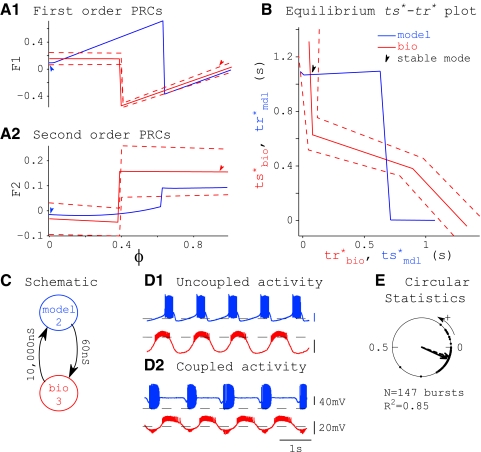
FIG. 10.
Prediction of phase-locking via depolarization block. A: PRCs. B: ts*–tr* plot. C: network schematic. D: network activity. Dotted lines are at the half-activation thresholds for artificial synapses with respect to their presynaptic neurons. E: circular statistics showing strong phase-locking. The prediction procedure illustrated in this figure is the same as that described in the legend for Fig. 5.

