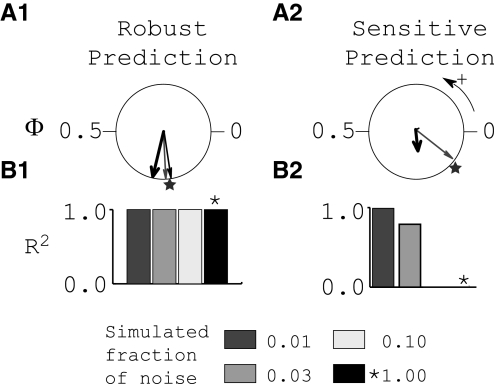
FIG. 9.
Effects of noise parameter in iterated map based on PRCs. A: circular statistics. Thick arrows show experimental observations; stars, predicted network phase; thin arrows, iterated map results. B: R2 vs. simulated fraction of experimentally observed noise. Noise envelopes from biological PRCs were scaled by the values shown and used in the iterated map. Values of R2 summarizing the strength of 1:1 phase-locking seen in the iterated map are shown. A1 and B1 are based on data shown in Fig. 5. A2 and B2 are based on data shown in Fig. 8.

