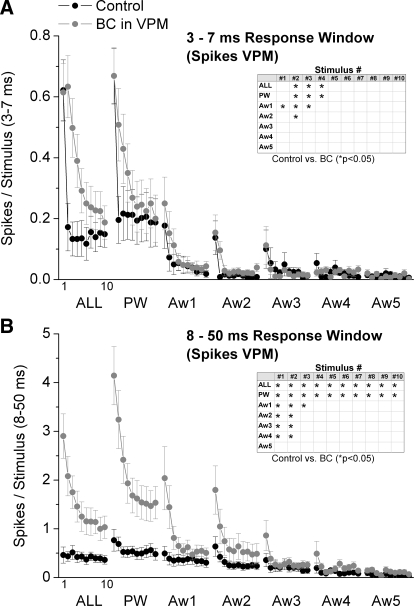
FIG. 4.
Population data showing the effect of thalamic disinhibition on short- and long-latency VPM cell responses. A: short-latency responses, measured during a 3- to 7-ms window poststimulus, evoked in VPM cells during control (black symbols) and during thalamic disinhibition (BC; gray symbols). The x axis shows the responses evoked by each of the 10 stimuli in the 10-Hz train. Each block of 10 stimuli correspond (left to right) to multiwhisker stimulation delivered simultaneously to all 6 whiskers (ALL), single-whisker stimulation of the PW and of each of the 5 AWs (Aw1–Aw5). Inset: asterisk marks the responses that showed a significant effect of disinhibition as determined with a pair-wise comparison. B: the graph is organized as in A but shows long-latency responses measured during an 8- to 50-ms window poststimulus.

