FIG. 8.
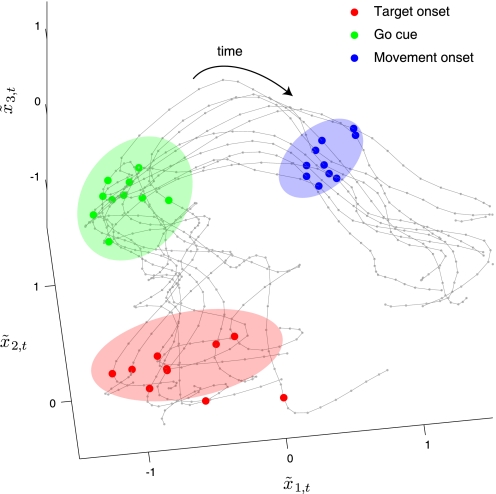
Top 3 dimensions of orthonormalized neural trajectories for GPFA with p = 15. Each gray trace corresponds to a single trial (same 10 trials as in Figs. 6 and 7). Small gray dots are time points separated by 20 ms. Larger dots indicate time of reach target onset (red), go cue (green), and movement onset (blue). Ellipses (two SD around mean) indicate the across-trial variability of neural state at reach target onset (red shading), go cue (green shading), and movement onset (blue shading). These ellipses can be obtained equivalently in two ways. One can either first project the neural states from the optimal 10-dimensional space into the 3-dimensional space shown, then compute the covariance ellipsoids in the 3-dimensional space; or, one can first compute the covariance ellipsoids in the 10-dimensional space, then project the ellipsoids into the 3-dimensional space. The covariance ellipsoids were computed based on all 45 trials with delay periods >400 ms for this reach target.

