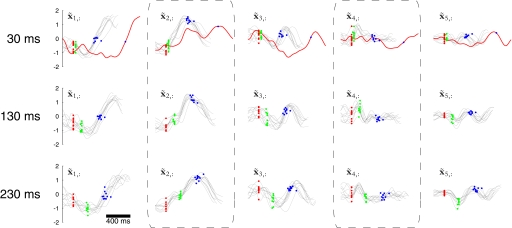
FIG. 9.
Orthonormalized neural trajectories for trials with discrete delay periods of 30 ms (top row), 130 ms (middle row), and 230 ms (bottom row). The red traces in the top row correspond to a single trial with an outlying reaction time (reaction time: 844 ms, trial ID 68). The top 5 orthonormalized dimensions of a GPFA model fit with p = 15 are shown for each delay period; the remaining orthonormalized dimensions are qualitatively similar to dimensions 6 to 15 in Fig. 7. Dotted boxes highlight the 2nd and 4th orthonormalized dimensions, which are referred to in results. For clarity, only 10 randomly chosen trials of each delay period are plotted, aligned on target onset. All trials shown correspond to the reach target located at distance 100 mm and direction 45°. Figure conventions are otherwise identical to those in Fig. 6. There is a small amount of temporal jitter in the green points due to the refresh rate of the visual display projector. Experiment G20040124, q = 62 units.

