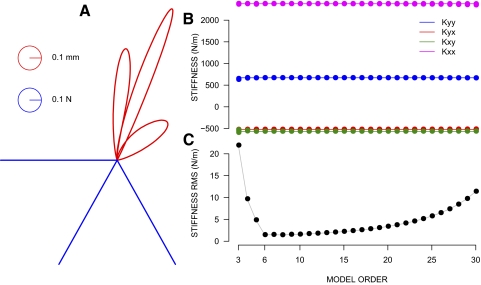
FIG. A1.
Evaluation of the moving-average (MA) estimation procedure. A: trajectories of the position signal (red curves) obtained by simulating a 2-dimensional critically damped 2nd-order linear system fed with 3 different force pulses (blue lines) at angles 180, 240, and 200°. Stiffness values 2,440 N for the major axis and 608 N for the minor axis were used in this example. The curl component was equal to 44.6 N and the matrix was oriented at −0.183 rad. These values are close to the values estimated empirically for the jaw. B: the estimated values of the 4 components of the stiffness matrix [Kxx, Kxy; Kyx, Kyy] for different orders of the MA estimation procedure between 3 to 30 are shown in dots. The horizontal lines correspond to the actual value of each component. C: root mean square (RMS) of the stiffness estimation error. For each MA order, the RMS value was computed by pooling together the estimation errors of the 4 components of the matrix across the different viscosity factors (0.5, 1.0, and 2.0) as well as the 3 different combinations of stiffness values for the major and minor axes.

