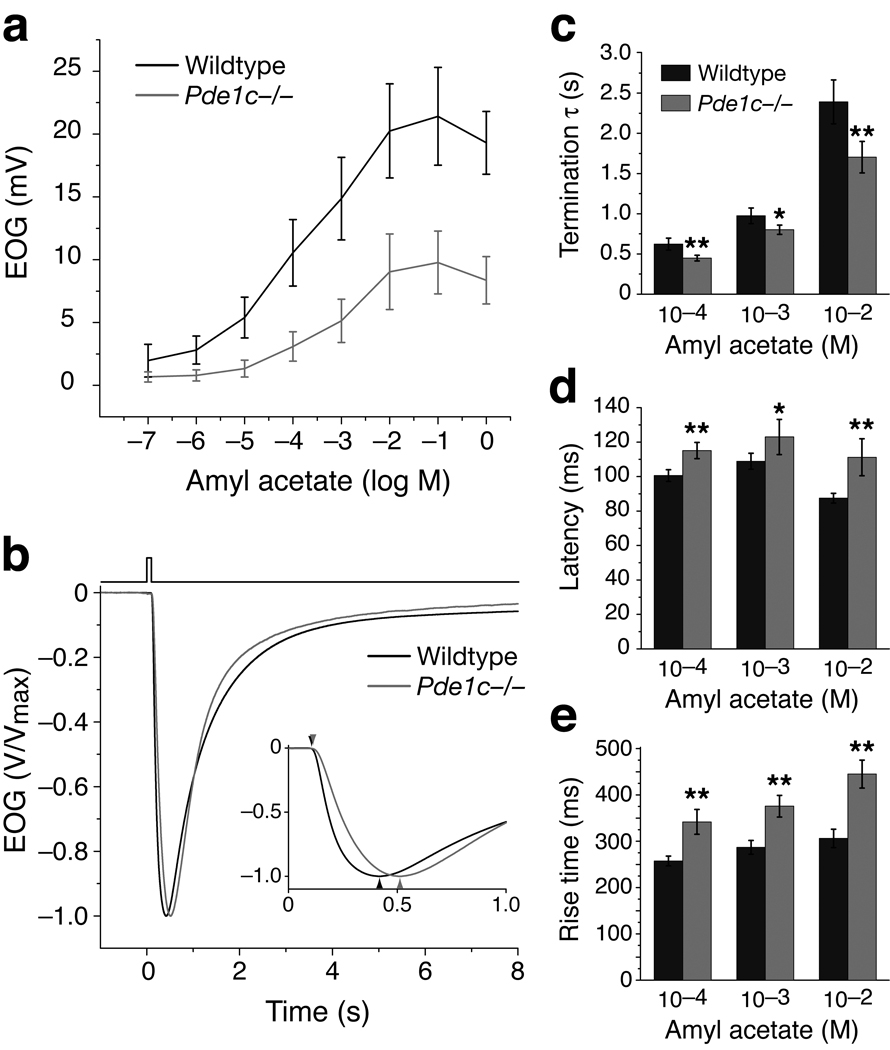
Figure 2. Pde1c−/− OSNs display reduced EOG amplitude, faster response termination, and slower onset kinetics.
(a) Dose-response relations of EOG responses to amyl acetate from wildtype (n = 7) and Pde1c−/− (5) mice. Amyl acetate was delivered as 100 ms pulses. Concentrations on the X-axis are those of the liquid solution. Data points are linked with straight lines; error bars are SD. (b) EOG responses to a single 100 ms pulse of 10−3 M amyl acetate. Responses are normalized and averaged for comparison of response kinetics (Wildtype, n = 15; Pde1c−/−, 10). Inset shows the traces plotted on an expanded time axis. (c) Termination time constants (τ), determined by a single exponential fit to the decay phase of the EOG signal. For 10−4 M, 10−3 M, and 10−2 M, P = 9.7x10⁻⁴, 0.011, and 8.4×10⁻⁴; wildtype, n = 20; Pde1c−/−, n = 14. (d) Response latencies, defined as the time between the initiation of odor pulse and the start of the response (1% of peak amplitude). For 10−4 M, 10−3 M, and 10−2 M, P = 4.5×10⁻⁵, 0.011, and 5.1×10⁻⁵; wildtype, n = 15; Pde1c−/−, n = 10. (e) Response rise times, defined as the time from the start of the response to the peak. For 10−4 M, 10−3 M, and 10−2 M, P = 1.1×10⁻⁶, 9.0×10⁻⁷, 5.8×10⁻⁸; wildtype, n = 15; Pde1c−/−, n = 10. In (c–e), error bars are 95% CI. P values are from unpaired t-tests. *, P < 0.05; **, P < 0.01.

