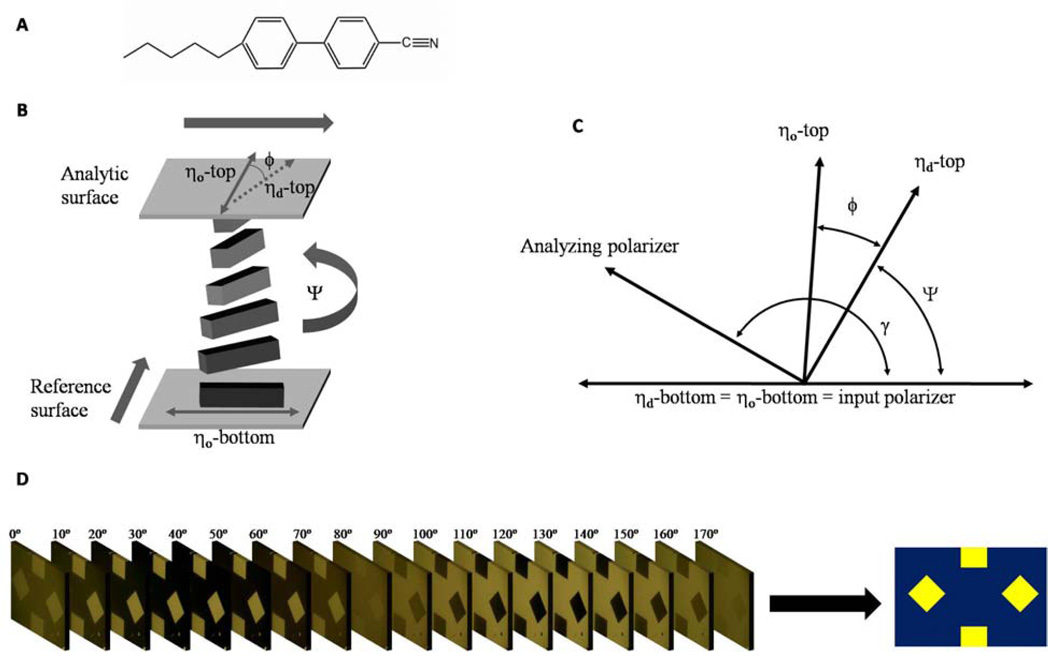
Figure 1.
(A) Molecular structure of 5CB (B) Schematic illustration of TNLC. Bold arrows indicate the in-plane direction of deposition of the gold films that confine the LC. The angles indicated in the diagram are defined in the text. (C) Diagram of the angles used to analyze the TNLC between two polarizers. (D) A stack of images of a TNLC obtained using orientations of the analyzer ranging from 0 ° to 170 °. Image analysis condenses the information present in the stack of images into a single map of the twist angle over the entire surface.

