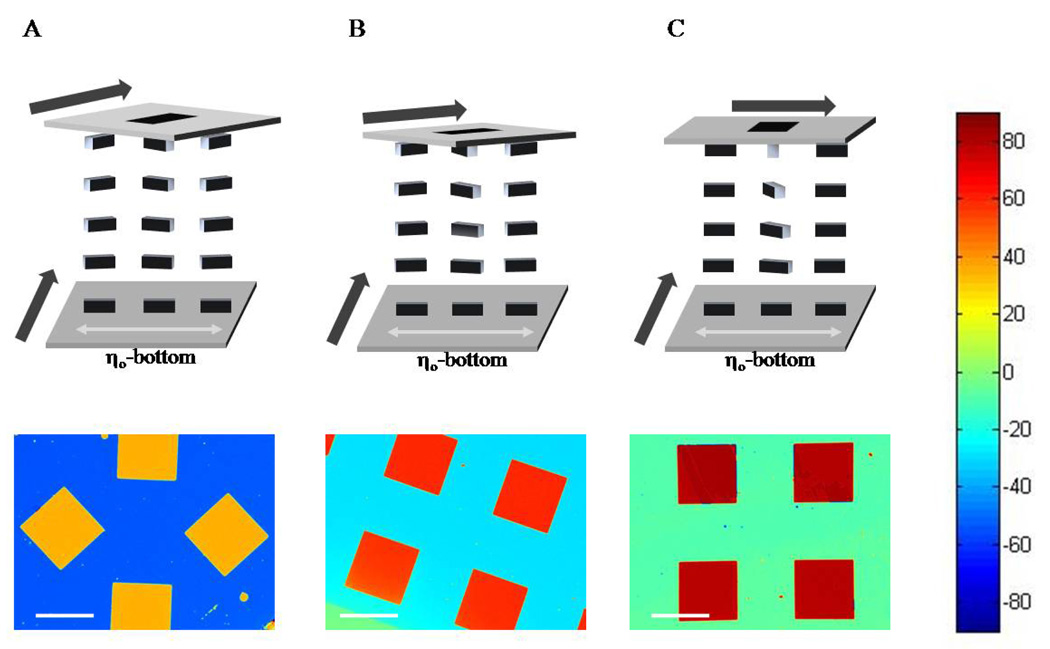
Figure 2.
Schematic representation of TNLCs (top) and corresponding maps of twist angles of the LC (bottom) obtained using analytic surfaces patterned with hexadecanethiol (continuous area of surface) and pentadecanethiol (squares). Twist angles of the LC corresponding to each color are indicated by the color chart shown at the right side of the figure. Bold arrows in the top diagrams indicate the in-plane direction of deposition of the gold films that confine the LC. The angle between the direction of deposition of the gold films in the analytic (top) and reference (bottom) surfaces of the cell was (A) 45 °, (B) 60 °, and (C) 90 °. See text for details. Scale bars indicate 1 mm.

