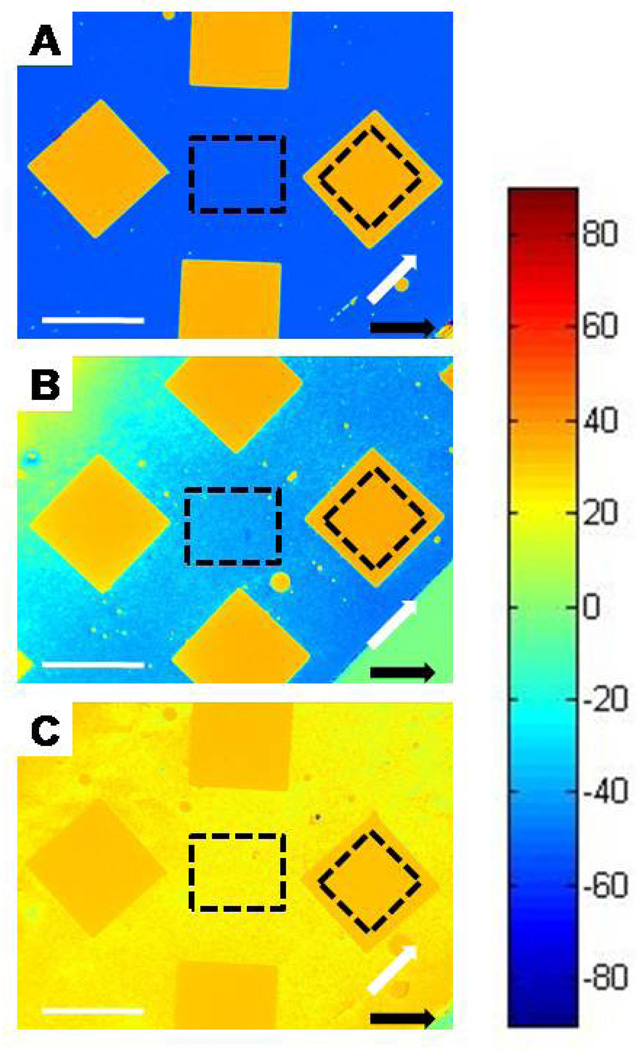
Figure 4.
Maps of twist angles of TNLCs in contact with analytic surfaces prepared by microcontact printing of hexadecanethiol, and subsequent immersion of the surfaces in pentadecanethiol solutions for (A) 10 mins, (B) 2hrs, and (C) 24 hr. The squares correspond to regions of the gold films on which hexadecanethiol was not microcontact printed. The direction of deposition of the gold on the analytic and reference surfaces is indicated by the white arrows and black arrows, respectively. Twist angles of the LC corresponding to each color are indicated by the color chart shown at the right side of the figure. Dashed squares indicate regions that were used to calculate average liquid crystal twist values. Scale bars represent 1 mm.

