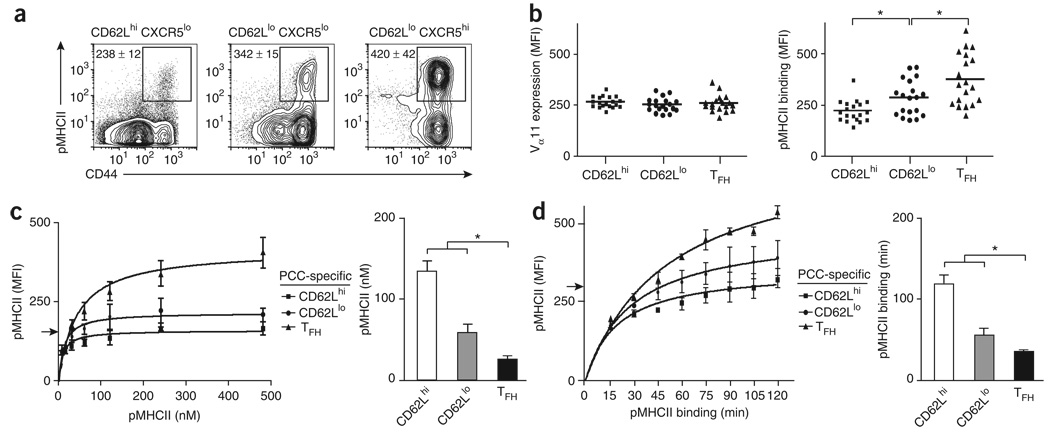
Figure 5. ‘Resident’ TFH cells have stronger pMHCII binding than do other effector helper T cells.
(a) Expression of pMHCII and CD44 on the surface of helper T cell subsets (CD8−CD11b−B220−prVα11+ and CD62LhiCXCR5lo, CD62LloCXCR5lo or CD62LloCXCR5hi) from lymph nodes on 7 d after PCC priming of mice. Numbers adjacent to outlined areas indicate MFI of each (mean ± s.e.m.; n ≥ 4 mice), (b) Vα11 expression and pMHCII tetramer staining for each PCC-specific effector helper T cell subset (all Vα11+pMHCII+CD44h; horizontal axis, as described for Fig. 1d key). Each symbol represents an individual mouse; small horizontal bars indicate the mean. *, P ≤ 0.01 (one-tail paired Student's t-test). (c,d) Left, pMHCII tetramer staining on the surface of PCC-specific helper T cell subsets (as in b; day 7 after priming) after staining with varying amounts of pMHCII tetramer (c) or with optimal pMHCII tetramer concentration but varying times of pMHCII tetramer binding (d). Right, pMHCII tetramer concentration required for each subset to reach an MFI of 150 (arrow at left; c) and time of pMHCII tetramer binding required for each subset to reach an MFI of 300 (arrow at left; d). Results presented as mean and s.e.m. (n = 3 mice for each condition). *, P ≤ 0.05 (unpaired Student's t-test). Data are representative of at least three experiments.

