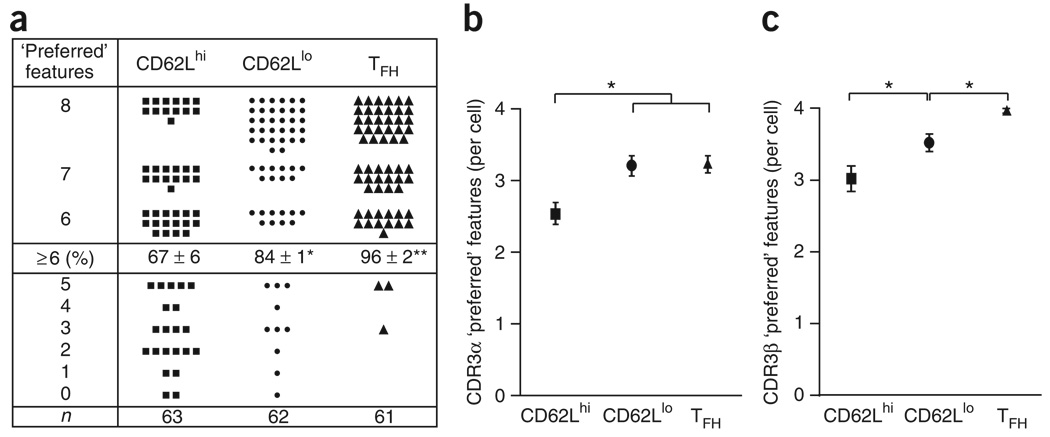
Figure 6. ‘Resident’ TFH cells express a more restricted TCR repertoire than do other effector helper T cells.
Single-cell repertoire analysis of individual PCC-specific effector helper T cells (Vα11+Vβ3+CD44hi) for each subset (as described in Fig. 1d), (a) Each filled symbol represents the number of the following ‘preferred’ CDR3 features known to be selected in the PCC response for a single cell: CDR3α, glutamic acid at α93, serine at α95, eight amino acids, Jα16, Jα17, Jaα22 and Jα34; CDR3β, asparagine at β100, alanine or glycine at β102, nine amino acids, Jβ1.2 and Jβ2.5. Middle row: percent cells (± s.e.m.) with six or more ‘preferred’ features, expressing a restricted TCR of the dominant clonotype (among n = number of single cells used in the analysis (bottom row); three individual mice). *, P ≤ 0.05, and **, P ≤ 0.01 (unpaired Student's t-test). (b,c) ‘Preferred’ CDR3 features for one single cell of each subset for the TCRα chain (b) or TCRβ chain (c), presented as the mean ± s.e.m. *, P ≤ 0.05 (unpaired Student's t-test). Data are representative of three experiments.

