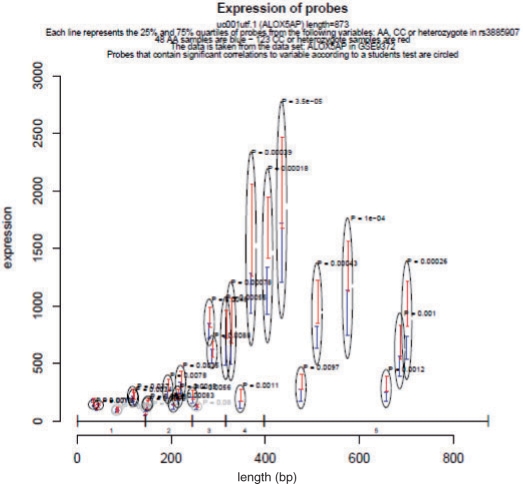
Fig. 1.
Effect of the rs3885907 SNP on the expression level of ALOX5AP. Visualization of the expression levels of all probes with sequences mapping to current ALOX5AP sequence. The data have been stratified by risk allele (AA) or non-risk allele (CC and heterozygote) of rs3885907. The y-axis indicates intensity values of each probe. The x-axis shows the length of the gene ALOX5AP, measured in base pair. Vertical bars show the span of the 25% and 75% quartiles of samples that are either AA (blue) or CC/heterozygote (red). Gray and black circles highlight probes, which have a significant relation to the genotype of the SNP. The significance of this relation has been calculated using a linear additive model as implemented in R. The exon structure of ALOX5AP is shown along the x-axis. It has been created using the exonStructure function based on sequence data from the UCSC genome browser. Expression data were taken from 171 samples in the Gene Expression Omnibus (GEO) dataset GSE9372. Genotype data were downloaded from the HapMap project.

