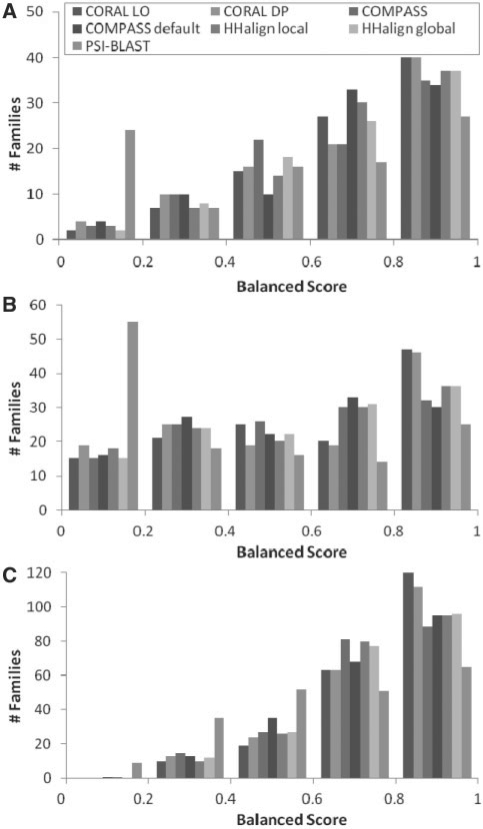
Fig. 1.
Distribution of balanced scores from three benchmark sets: (A) VAST structure superpositions; (B) SABmark structure alignments; and (C) curator-inferred guide alignments. SABmark alignments are grouped by SCOP superfamily and the others by CDD family. The balanced score is an average of accuracy over computed alignment and completeness in reconstructing the reference alignment.

