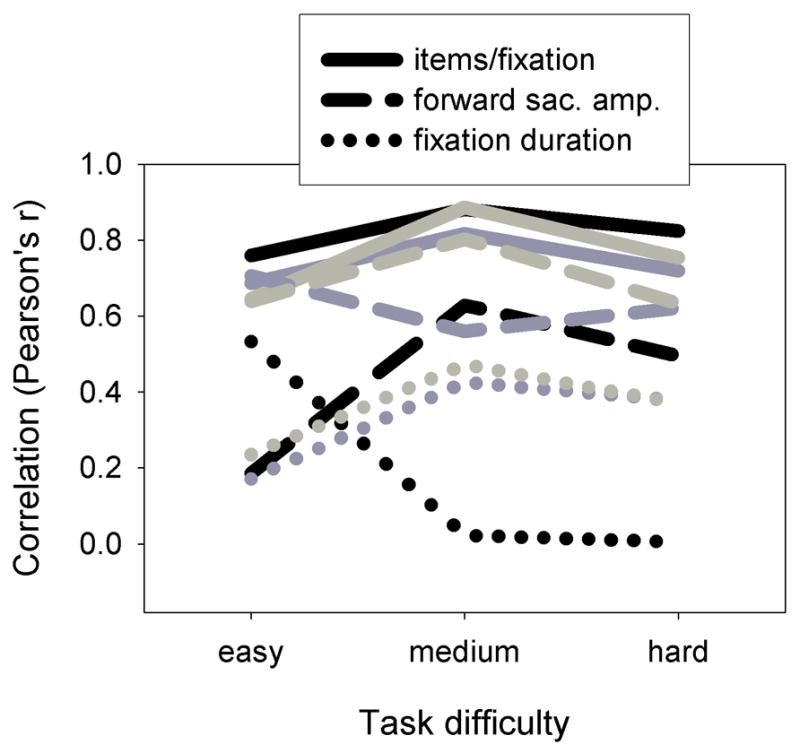
Figure 3.

Correlations between performance and oculomotor variables for experiment 1, plotted as a function of task difficulty level. Grayscale levels distinguish the subjects hh (black), pp (dark gray) and zz (light gray).

Correlations between performance and oculomotor variables for experiment 1, plotted as a function of task difficulty level. Grayscale levels distinguish the subjects hh (black), pp (dark gray) and zz (light gray).