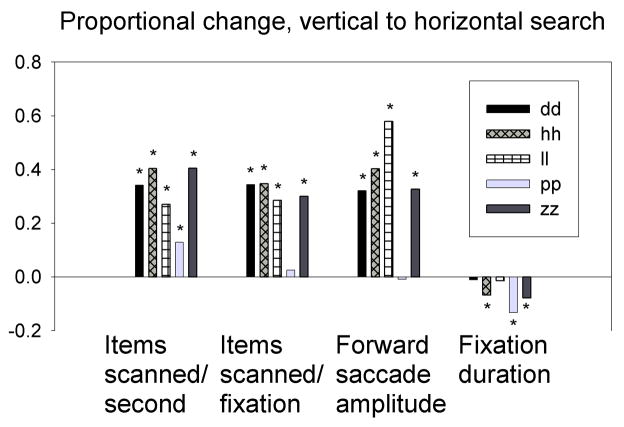
Figure 5.
Each bar represents the proportional change from vertical to horizontal search for the corresponding variable and subject, for experiment 2. Change was calculated using the equation (Xhorizontal − Xvertical)/Xvertical, where Xhorizontal is the value of the variable in question for horizontal searches, and Xvertical is the value for vertical searches. For example, a value of 0.32 for items scanned per second for subject dd indicates that dd’s horizontal searches were 32% faster than dd’s vertical searches. ‘*’ indicates the horizontal difference was significant by t-test at the level of p < 10−5; unmarked comparisons n.s.

