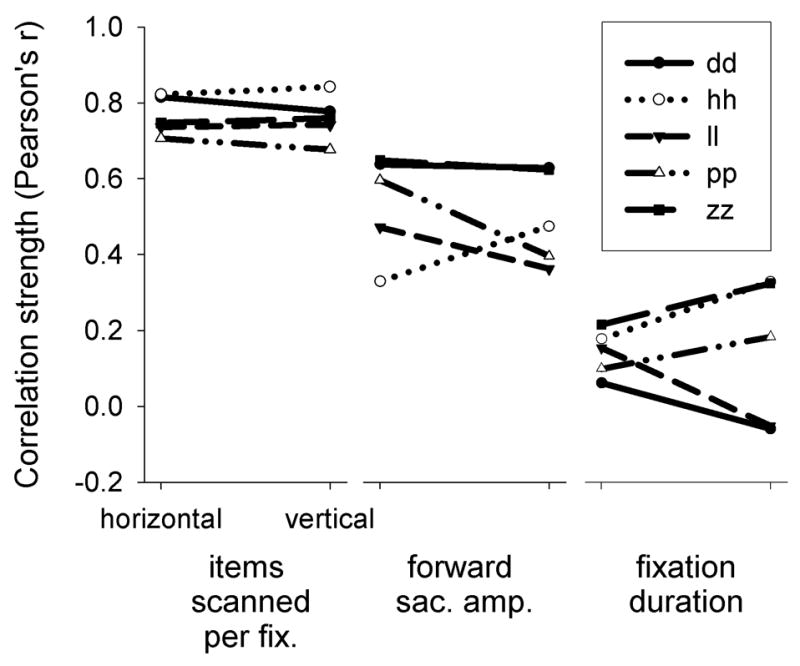
Figure 6.

Correlations between performance and oculomotor variables for experiment 2, plotted by search direction and subject. Each of the three panels displays correlations between performance and the corresponding variable for horizontal (left points) and vertical (right points) searches.
