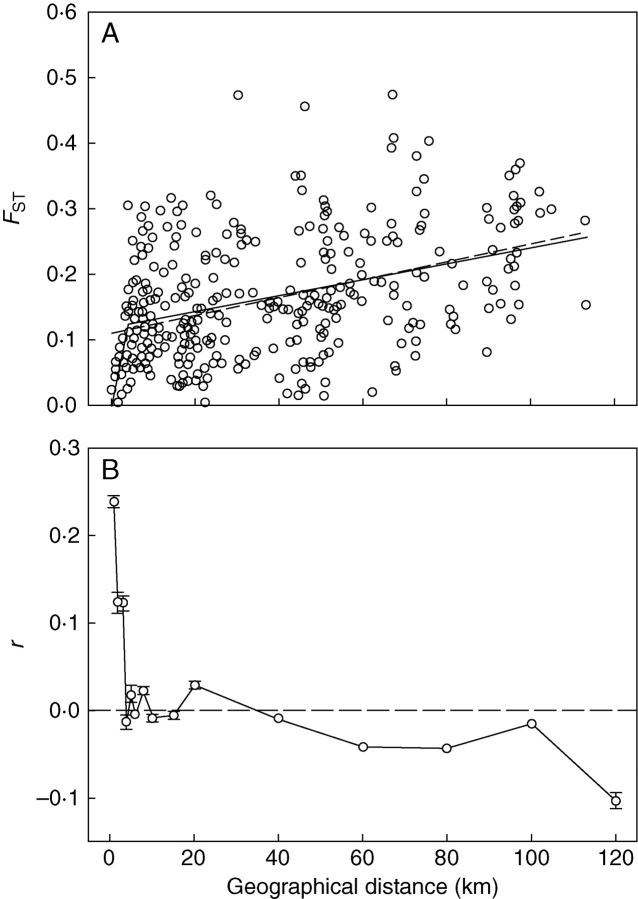
Fig. 4.
(A) Relationship between pairwise genetic (FST) and geographical distances for the 27 Narcissus longispathus populations included in this study. Shown are the conventional linear regression (dashed line) and the non-linear piecewise regression (solid line) fitted to the data. (B) Correlogram showing the multilocus, multiallelic genetic correlation (r) between individual Narcissus longispathus plants across the full range of distances occurring over the distribution area of the species (error bars are ± 2 s.e., as estimated by bootstrapping). Unequal distance classes were used to improve resolution at shorter distances (upper limits of distance classes: 1, 2, 3, 4, 5, 6, 8, 10, 15, 20, 40, 60, 80, 100, 120 km).

