Fig. 1.

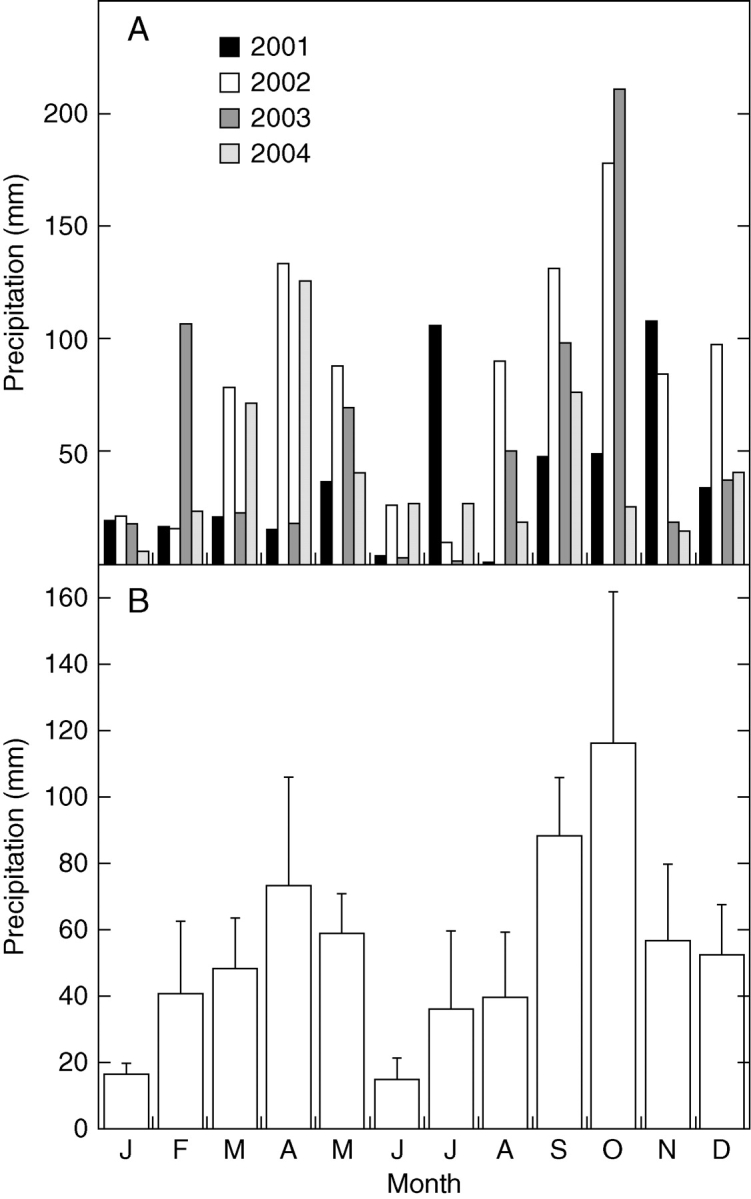
(A) Monthly precipitation and (b) monthly average precipitation based on the 4 years of study (2001–2004). Bars indicate the s.e.m. (n = 4 year means).

(A) Monthly precipitation and (b) monthly average precipitation based on the 4 years of study (2001–2004). Bars indicate the s.e.m. (n = 4 year means).