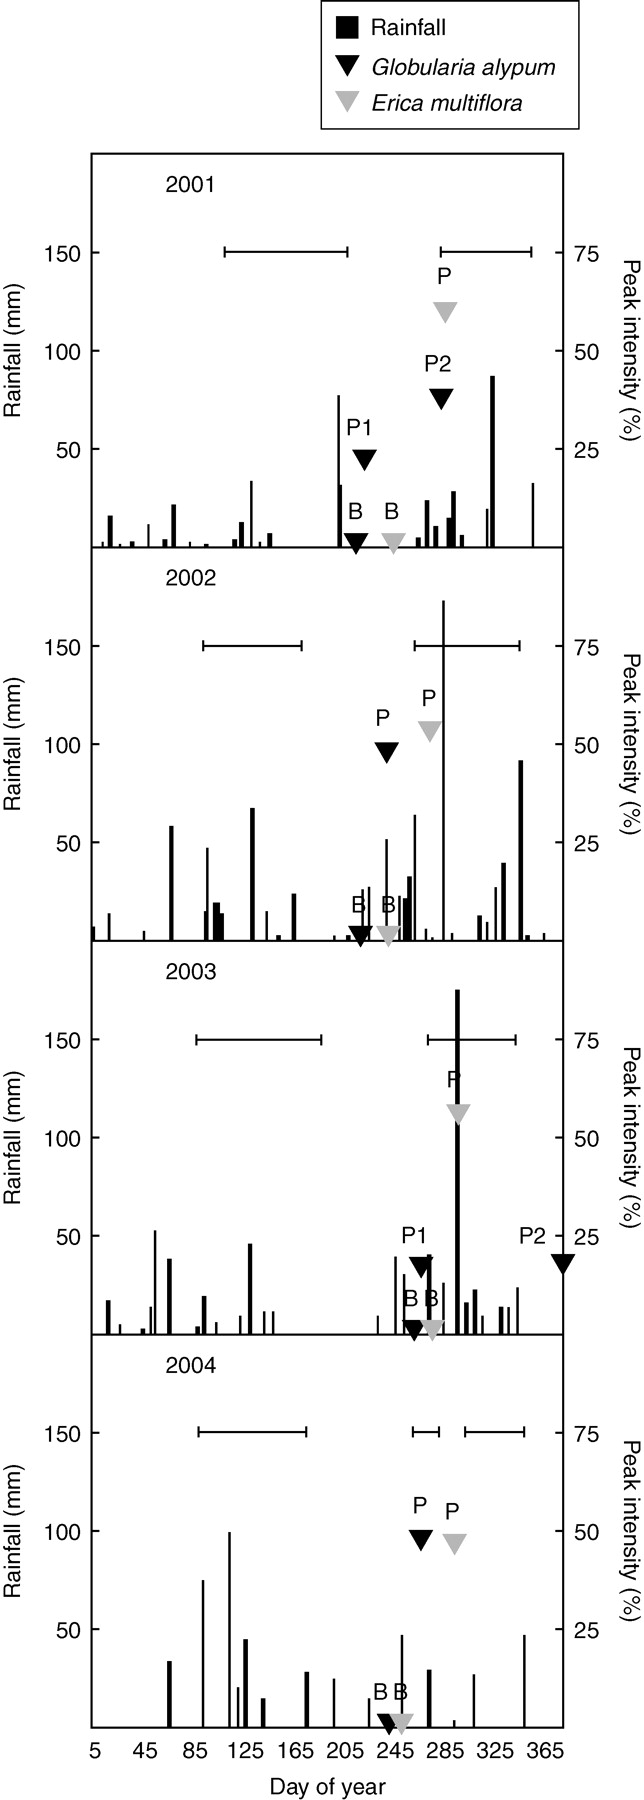
Fig. 2.

Distribution and magnitude of rainfall and beginning of anthesis (‘B’) and peak date (‘P’, date of maximum flowering intensity) for each year of the study for Globularia alypum and Erica multiflora in control plots. For Globularia alypum ‘P1’ indicates the first peak and ‘P2’ the second peak. Horizontal bars show the duration of the drought treatment.
