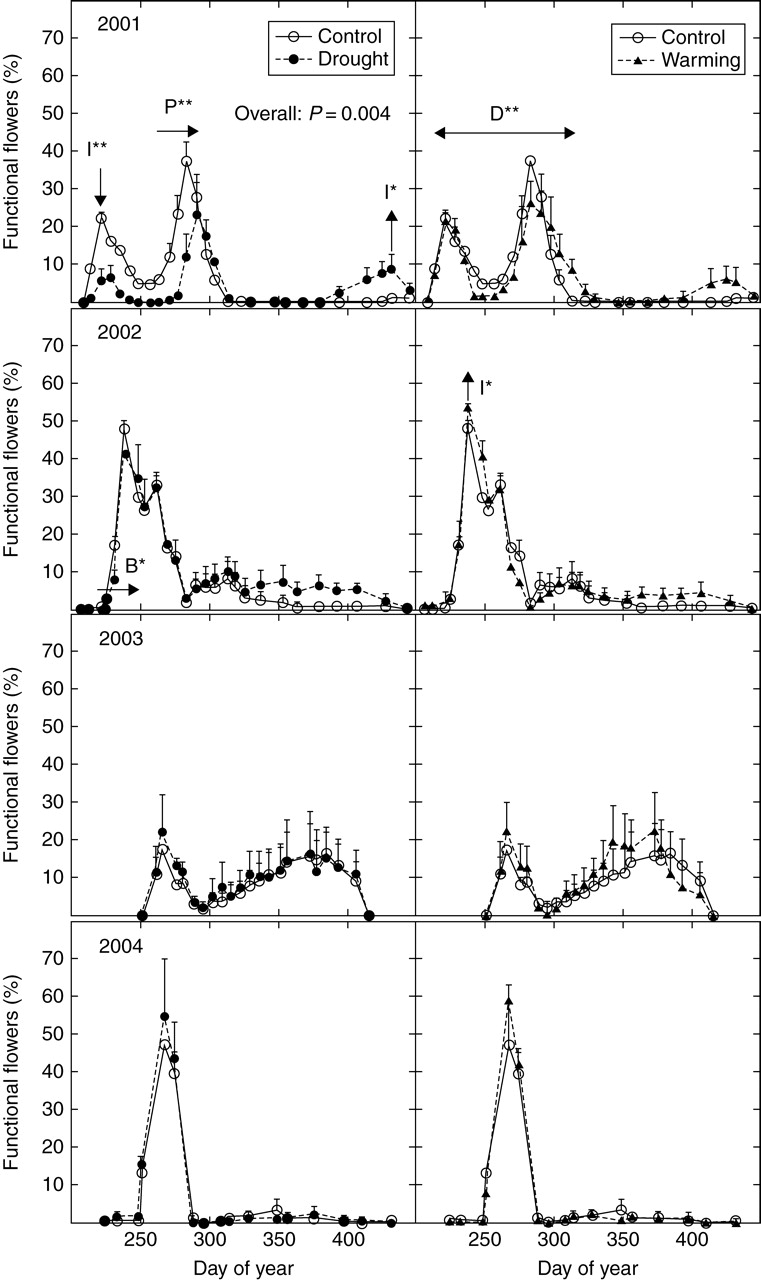
Fig. 3.

Annual flowering patterns for Globularia alypum in control, drought and warming treatments. Letters indicate significant treatment effects on the beginning date (B), peak date (P), peak intensity (I) and flowering duration (D): **, P < 0·05; *, P < 0·1. Arrows indicate the direction of the change.
