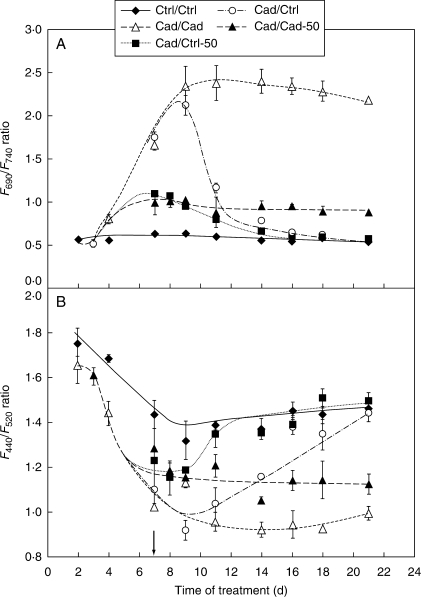
Fig. 4.
Changes in (A) the F690/F740 and (B) F440/F520 ratios of ‘+2’ leaves under different conditions. Only the Cad/Cad and Cad/Cad-50 plants showed strong significant differences (one-way ANOVA, P < 0·01) from the control at the end of the recovery period. The arrow shows the start of the recovery period. For treatments, see Table 1.

