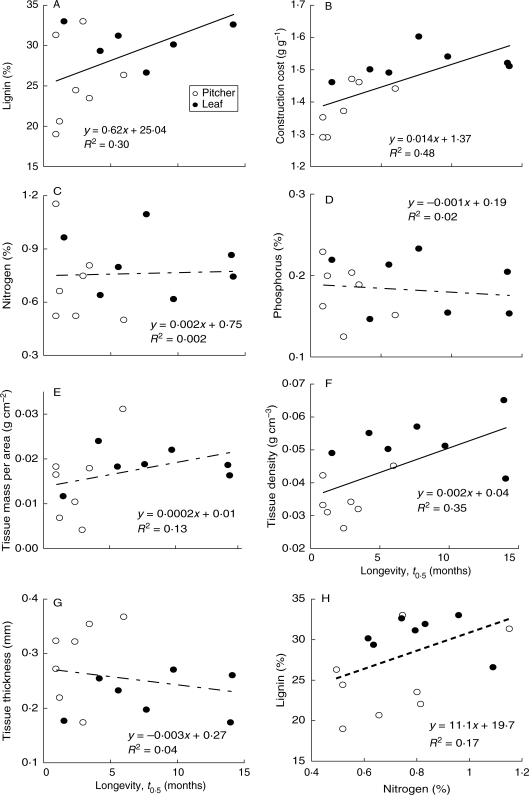
Fig. 2.
Relationships between longevity as determined by half lifetime (t0·5) vs. physico-chemical properties (A–G) and between nitrogen vs. lignin content (H) in eight Nepenthes species from Brunei, Borneo. Each point is the mean values from four to six sites; leaf (closed circles) and pitcher (open circles). Continuous lines indicate significant correlation across species and assimilatory organs at P < 0·05; faint dashed lines indicate non-significant trends at P > 0·10; the bold dashed line for nitrogen–lignin relationship indicates a marginally significant (P = 0·08) trend. For significance of trends within organs, see Table 2.

