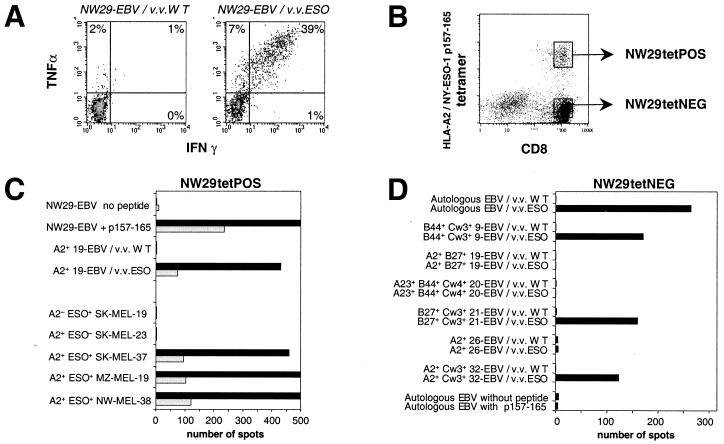
Figure 3.
Characterization of CD8+ T cells from patient NW29 after stimulation with autologous CD8-depleted PBLs infected with Ad2/ESO. (A) Cytospot analysis of IFN-γ and tumor necrosis factor-α production by NW29 effectors tested at day 27 against autologous EBV-B cells infected with wild-type vaccinia (Left) or with NY-ESO-1 vaccinia (Right). The cells were gated on CD8+ lymphocytes, and values indicate the percentage of cytokine-producing CD8+ T cells. (B) Tetramer staining of NW29 effectors presensitized for 13 days (see Fig. 2). Two polyclonal lines were derived after sorting of cell populations indicated by gates. (C) Elispot analysis of IFN-γ release by 1000 cells (solid bars) or 200 cells (open bars) from line NW29tetPOS in response to peptide-pulsed autologous EBV-B targets or vaccinia-infected HLA-A2+ histocompatible EBV-B targets, and to five melanoma cell lines (see Materials and Methods). (D) Elispot analysis of IFN-γ release by 5000 cells from line NW29tetNEG in response to a range of EBV-B cells infected with wild-type or NY-ESO-1 vaccinia virus. Only HLA alleles shared between NW29tetNEG effectors and EBV-B targets are indicated.

