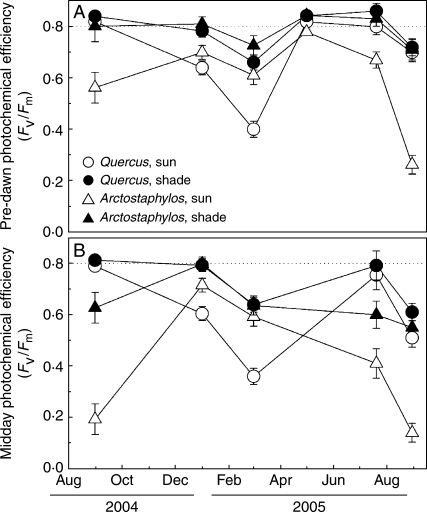
Fig. 4.
Pre-dawn (A) and midday (B) photochemical efficiency (Fv/Fm) of Quercus ilex and Arctostaphylos uva-ursi in sun and shade habitats. Dashed lines indicate the threshold of 0·8 as a reference for optimum Fv/Fm. Each symbol is the mean of a minimum of six plants. Error bars indicate the 95 % confidence intervals for the mean; thus, non-overlapping bars reveal significant differences (ANOVA, Fisher l.s.d. post hoc test).

