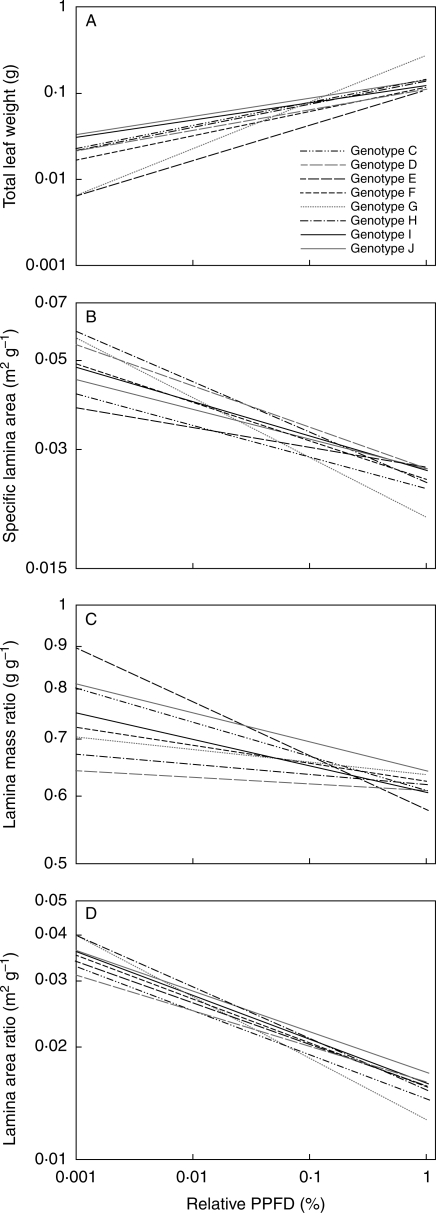
Fig. 2.
Allometric relationships between leaf characters of eight genotypes of Potentilla reptans and relative PPFD at the position of each leaf lamina: (A) total leaf weight (g); (B) specific lamina area (m2 g−1); (C) lamina mass ratio (g g−1); (D) lamina area ratio (m2 g−1). Lines represent linear regression lines of the genotypes as indicated, based on log-transformed data of all plots pooled together. Covariance analysis is given in Table 1.

