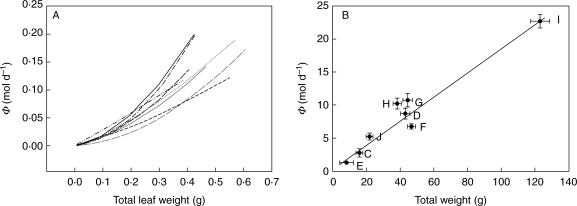
Fig. 4.
Power relationship between light capture (mol d−1) and mass (g). Data are represented on a normal scale for clarity. (A) Power relationship between light capture of individual leaves (mol d−1) and total leaf weight (TLW, g). β is the regression coefficient in the linear expression: log Φd = log α + β logTLW, with β > 1 indicating a disproportional increase of Φ with total leaf weight. Different lines indicate the regressions for different plots. Average β = 1·56, which was significantly larger than 1 (t = 5·42, P = 0·001). (B) Power relationship between average total light capture of the genotypes (mol d−1) and total weight of the genotypes (g). The line represents the regression of all measurement of all eight plots. Average β for all eight plots = 1·03, which was not significantly different from 1 (t = 0·034, P = 0·974).

