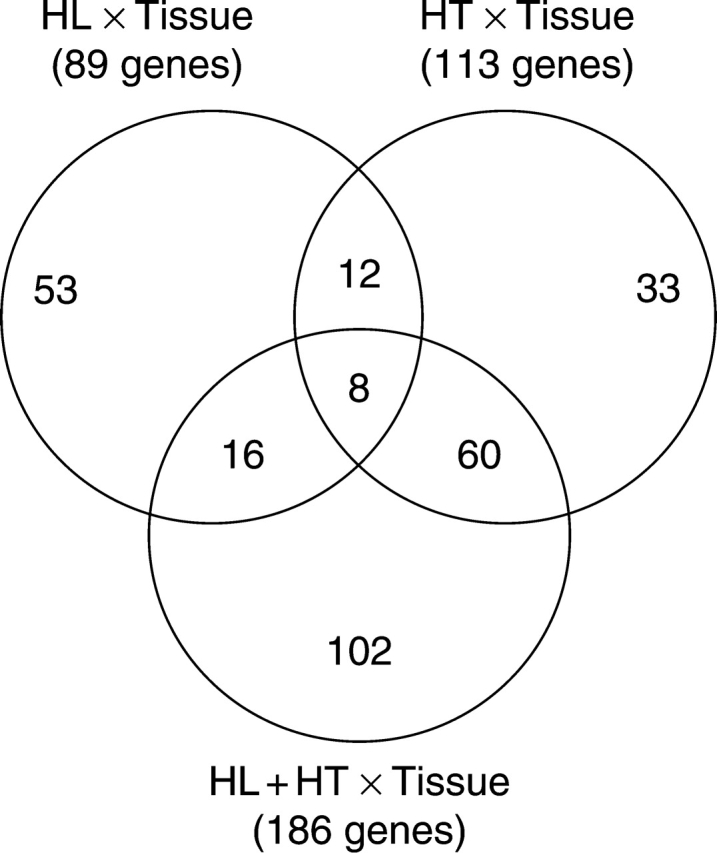
Fig. 4.

Venn diagram showing the number of genes having significantly different expression levels in leaves and immature seeds in response to HL, HT and HL + HT. The numbers in the overlapping areas indicate the number of cDNA clones that exhibited shared interaction responses to either two or three stress treatments compared with non-stressed controls.
