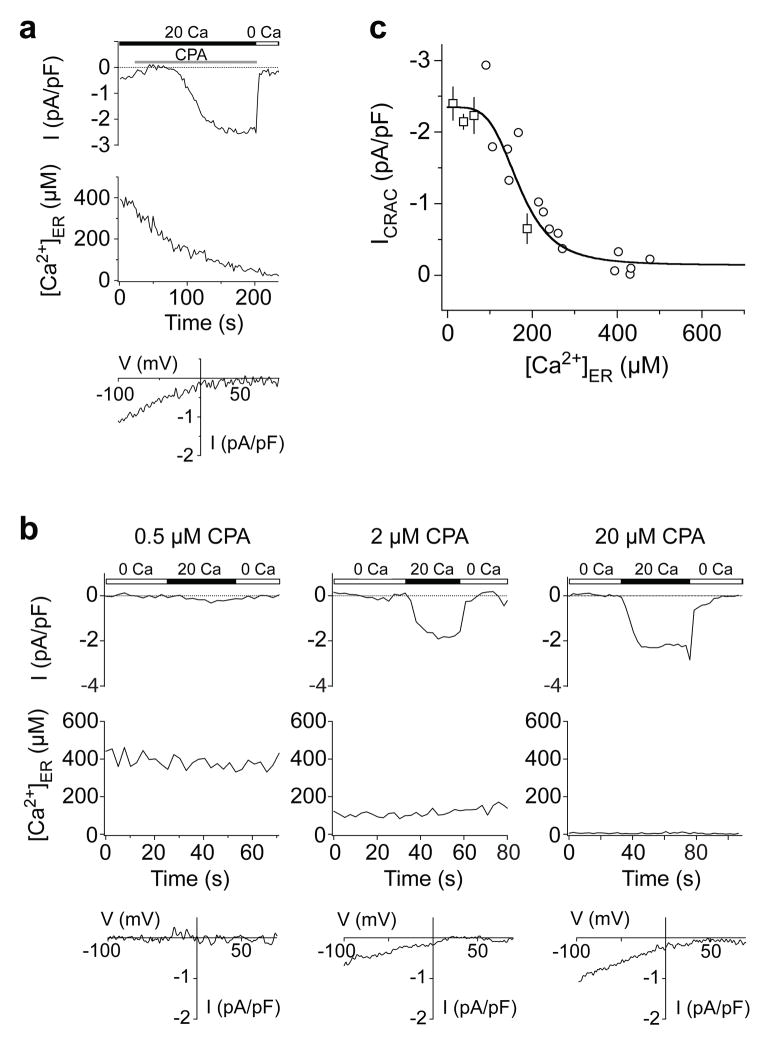
Figure 1. The [Ca2+]ER-response relation for the CRAC channel.
Simultaneous measurements of [Ca2+]ER and ICRAC in individual Jurkat T cells. a, Non-stationary measurements of ICRAC and [Ca2+]ER. Store depletion with 20 μM CPA induces an increase in ICRAC (top) that follows a decrease in [Ca2+]ER (middle) monitored with YC4.2er. The I-V relationship shows the inward rectification typical of ICRAC (bottom). In this cell, a small inward current through outwardly-rectifying Cl− channels is also present initially but disappears before ICRAC is induced. b, Recordings of ICRAC (top) and [Ca2+]ER (middle) under steady-state conditions. Each cell was treated with the indicated CPA concentration for 8–15 min prior to recording, and CPA was maintained throughout the experiment. I-V relations are typical for ICRAC (bottom). c, Steady-state ICRAC and [Ca2+]ER are plotted for 40 cells after treatment with 0.5–20 μM CPA. A fit of the Hill equation with a K1/2 of 169 μM and Hill coefficient of 4.2 is superimposed on the data. Squares: mean ± s.e.m. of 3–12 cells. Circles: single cells (see Supplementary Information).

