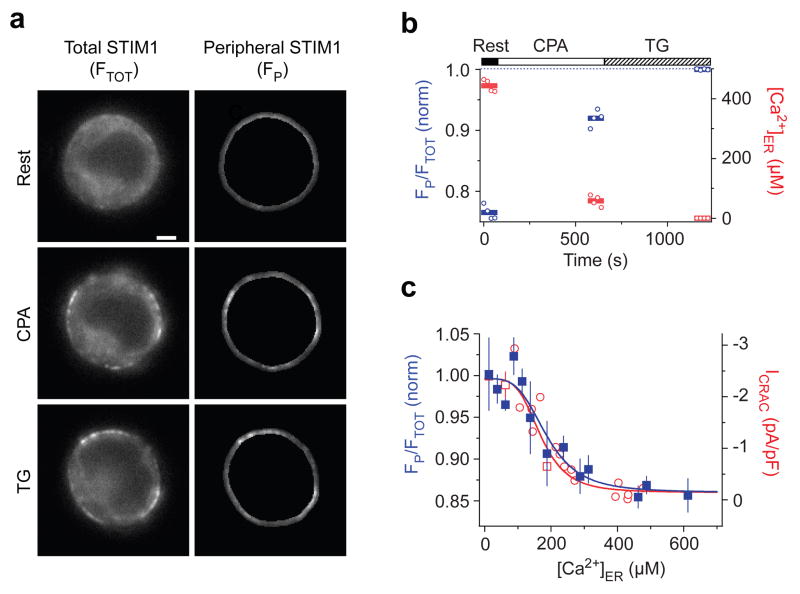
Figure 2. The [Ca2+]ER dependence of STIM1 redistribution determines the [Ca2+]ER-response relation of the CRAC channel.
a,Widefield epifluorescence images of a cell expressing Cherry-STIM1 at rest (top) and following store depletion with 3 μM CPA (middle) and TG (bottom). The redistribution of Cherry-STIM1 in single cells was monitored as the ratio of the mean Cherry fluorescence in the most peripheral 0.5 μm of the cell (FP, right) to the mean fluorescence of the entire cell (FTOT, left). Scale bar = 2μm. b, In the same cell, STIM1 redistribution represented by FP/FTOT normalized to the maximum ratio with TG (blue). FP/FTOT increases as [Ca]ER (red) declines. Individual data points (open symbols) and the mean response (bars) are shown. c, STIM1 redistribution (FP/FTOT, blue) plotted against [Ca2+]ER after treatment with 0–3 μM CPA (means ± s.e.m. of 3–4 cells; 41 cells total). A fit of the Hill equation (blue line) indicates a K1/2 of 187 μM and Hill coefficient of 3.8. Steady-state ICRAC data fitted with the Hill equation are re-plotted from Fig. 1 (red).

