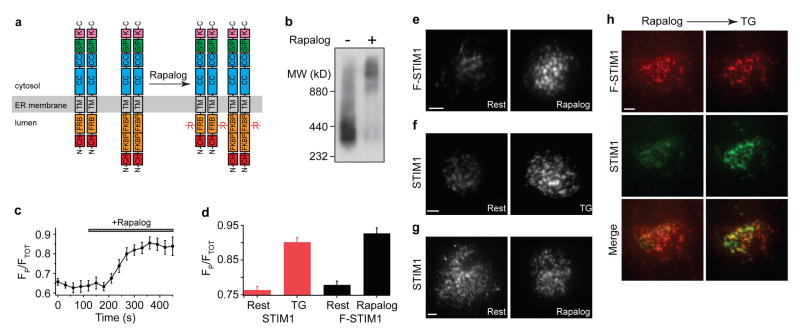
Figure 3. STIM1 oligomerization induces the accumulation of STIM1 at ER-plasma membrane junctions.
a, The cartoon depicts the oligomerization of F-STIM1 induced by rapalog (R). At rest, FKBP-STIM1 and FRB-STIM1 are expected to form homo- and heterodimers; only intermolecular crosslinks between homodimers are shown here. Abbreviations: EF (EF hand), SAM (sterile-α motif), CC (coiled-coil), S/P (serine-proline-rich), K (lysine-rich), CH (mCherry). b, BN-PAGE and Western blot of transiently expressed F-STIM1 harvested from HEK293 cells. Untreated (left) and rapalog-treated (right) F-STIM1 was detected using a monoclonal anti-STIM1 antibody. c, Rapalog induces a time-dependent peripheral redistribution of F-STIM1 (n=10 cells). d, Peripheral redistribution of Cherry-STIM1 by TG (red bars; n=31 for each) and redistribution of F-STIM1 by rapalog (black bars; n=39, rest; n=42, rapalog). Values expressed as mean ± s.e.m. (c, d). e–h, TIRF images of Jurkat cells, scale bar = 2 μm. e, F-STIM1 before (left) and after (right) incubation with rapalog. f, Cherry-STIM1 before (left) and after (right) store depletion with TG. g, Cherry-STIM1 before (left) and after (right) incubation with rapalog. h, F-STIM1 (top row), GFP-STIM1 (middle row) and merged images (bottom row) from a single cell after rapalog treatment (left column) and subsequent store depletion with TG (right column). Cherry and GFP intensities are scaled to the maximal intensity of each fluorophore after TG treatment.

