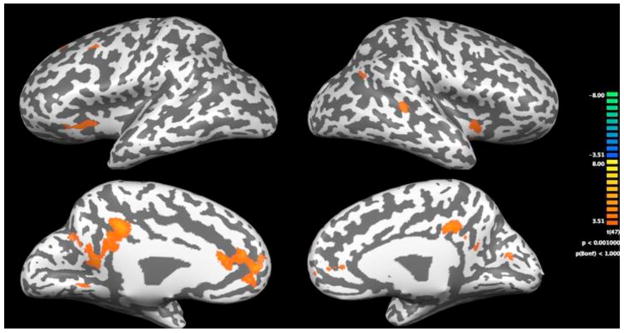
Figure 5.
Brain activation of children in MD group versus children in TD group on the approximate calculation task. Brain activation patterns of children are depicted on an inflated brain template. The top row of figures show the lateral view, and the lower row of figures show the medial view. The colored key provides significance levels for activation.

