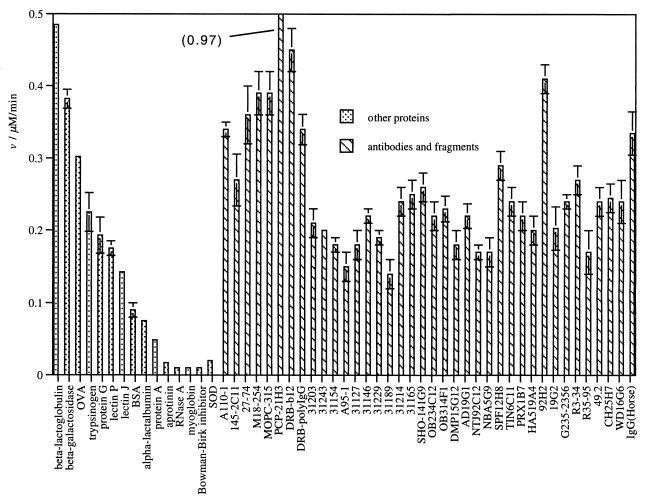
Figure 6.
Bar graph showing the measured initial rate of H2O2 formation for a panel of proteins and comparison with antibodies (data from Table 1). All points are mean values of at least duplicate experimental determinations. Error bars are the range of experimentally measured values from the mean. OVA, chick-egg ovalbumin; SOD, superoxide dismutase.

