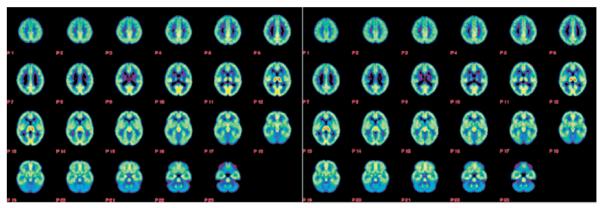
Figure 1.
Averaged parametric images (λk3) of the high (left panel) and the low (right panel) MAO A genotype groups showing 23 transaxial planes from the top of the head to the base of the skull and using a rainbow color scale where red indicates regions of highest monoamine oxidase A (MAO A) activity and blue indicates regions of lowest MAO A activity. Note the similarity in image intensity between the two groups, corroborating the findings of the region of interest analysis (Table 1).

