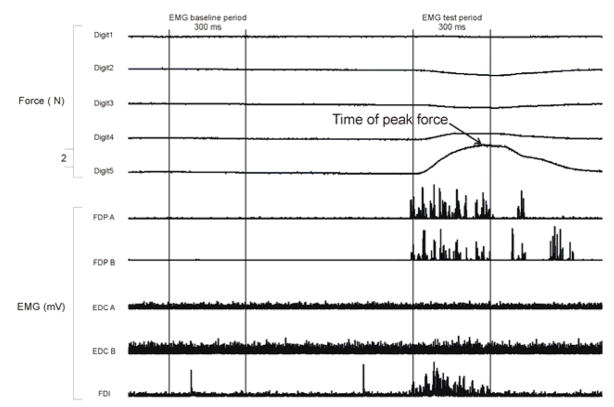
Figure 2. Relative timing of EMG and force analyses.
A continuous record of force and rectified EMG data recorded from one subject during a single trial in which the subject was instructed to flex the little finger. In this example the subject reached peak force 120 ms after reaching the criterion force level, which was always the midpoint of the 300 ms EMG test period. On average, subjects reached peak force 161 ms (SD = 29) after they attained the minimum criterion force level.

