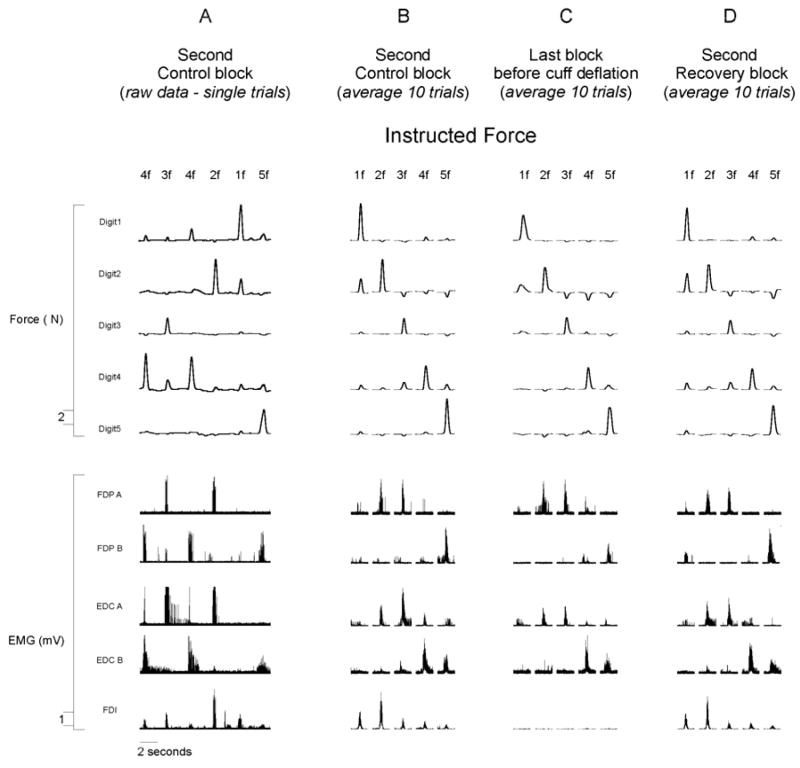
Figure 3. Single trial average rectified EMG and force data from one participant.
(A) A continuous record of force and rectified EMG data recorded from one subject during six sequential trials of the second control block (approximately 10 minutes after the recording session began). (B–D) Averaged data from the same subject (average of 10 trials of each instructed finger flexion) recorded during the second control block (B), the last block before cuff deflation (C), and the second recovery block (D). The instructed finger flexion on each trial is indicated at the top of the figure.

