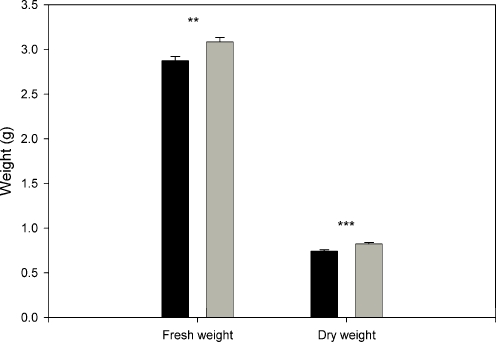
Fig. 3.
Aboveground biomass of Plantago lanceolata. Fresh weight was recorded once for each plant, on the day the volatile collection was performed. Black bars = mycorrhizal plants, grey bars = non-mycorrhizal plants. Bars represent means ± SE. Asterisks represent significant differences according to Student’s t-test (**P < 0.01, ***P < 0.001)

