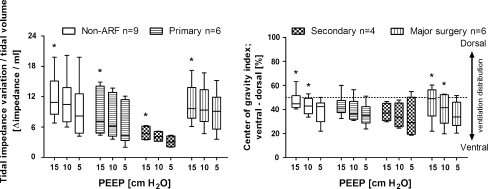
Fig. 3.
Tidal impedance variation at the studied PEEP levels. Left panel shows the ratio of tidal impedance variation divided by tidal volume (impedance/ml). This ratio is the slope between tidal impedance variation and tidal volume. Right panel shows the center of gravity index. Global tidal impedance variation was divided in two equal regions of interest, dorsal and ventral, each accounting for 50% of the EIT image. The center of gravity was calculated by dividing the dorsal tidal impedance variation by the total tidal impedance variation. Patients are divided into groups according to the type of lung condition. Group N = non-ARF, group P = primary lung disorder, group S = secondary lung disorder, group MS = admitted to the ICU after major thoracic or abdominal surgery. Data are presented as box=and-whisker plot (min.-25–50–75%-max.), asterisks indicate significance compared to 5 cm H2O PEEP within each group, P < 0.05

