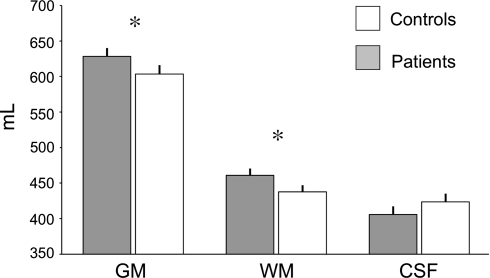
Fig. 2.
Absolute volumes of gray matter, white matter and cerebrospinal fluid in acromegalic patients (N = 44) and control subjects (N = 44). Bars show estimated marginal means (+SEM) corrected for age and gender, of the three compartments for patients and controls. GM: gray matter, WM: white matter, CSF: cerebrospinal fluid. *Significant differences for the group factor emerged for comparison of GM (P = 0.018) and WM (P = 0.035). CSF differences were significant for normalized, but not for absolute volumes (see result section)

