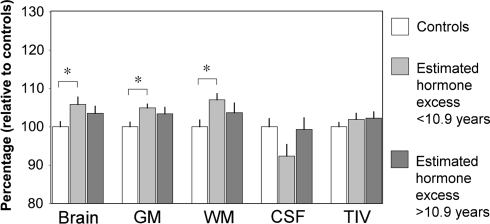
Fig. 3.
Influence of the estimated time of hormone excess. Depiction of estimated marginal means (+SEM) after correction for age and gender effects, relative to mean values of the control group. Post-hoc comparisons revealed significant increases (*P < 0.05) in the patient subgroup I (below median 10.9 years of estimated hormone exposure) with regard to GMtotal, WMtotal and absolute total brain volume. See result section for the analysis of normalized volumes

