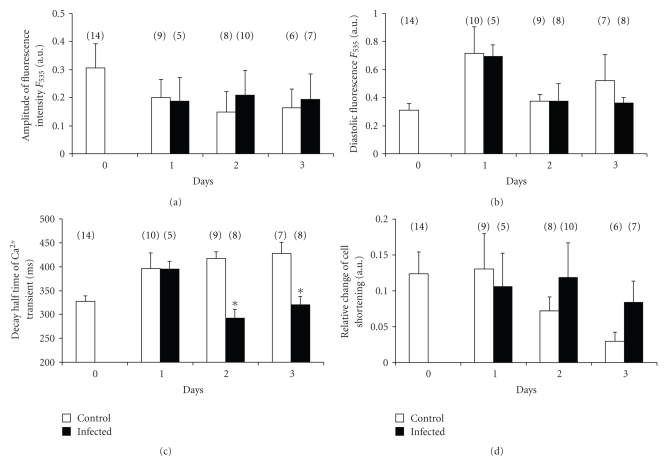
Figure 6.
This figure shows several parameters of intracellular free calcium transient such as (a) amplitude of calcium transients, (b) diastolic calcium levels, (c) changes of calcium transient decay constant, and (d) cell-shortening measurements from recordings from control and from virus infected myocytes after 1 to 3 days long culture. Bars represent means ± SEM, and n represents the number of experiments.

